Data Visualisation & Live Dashboards
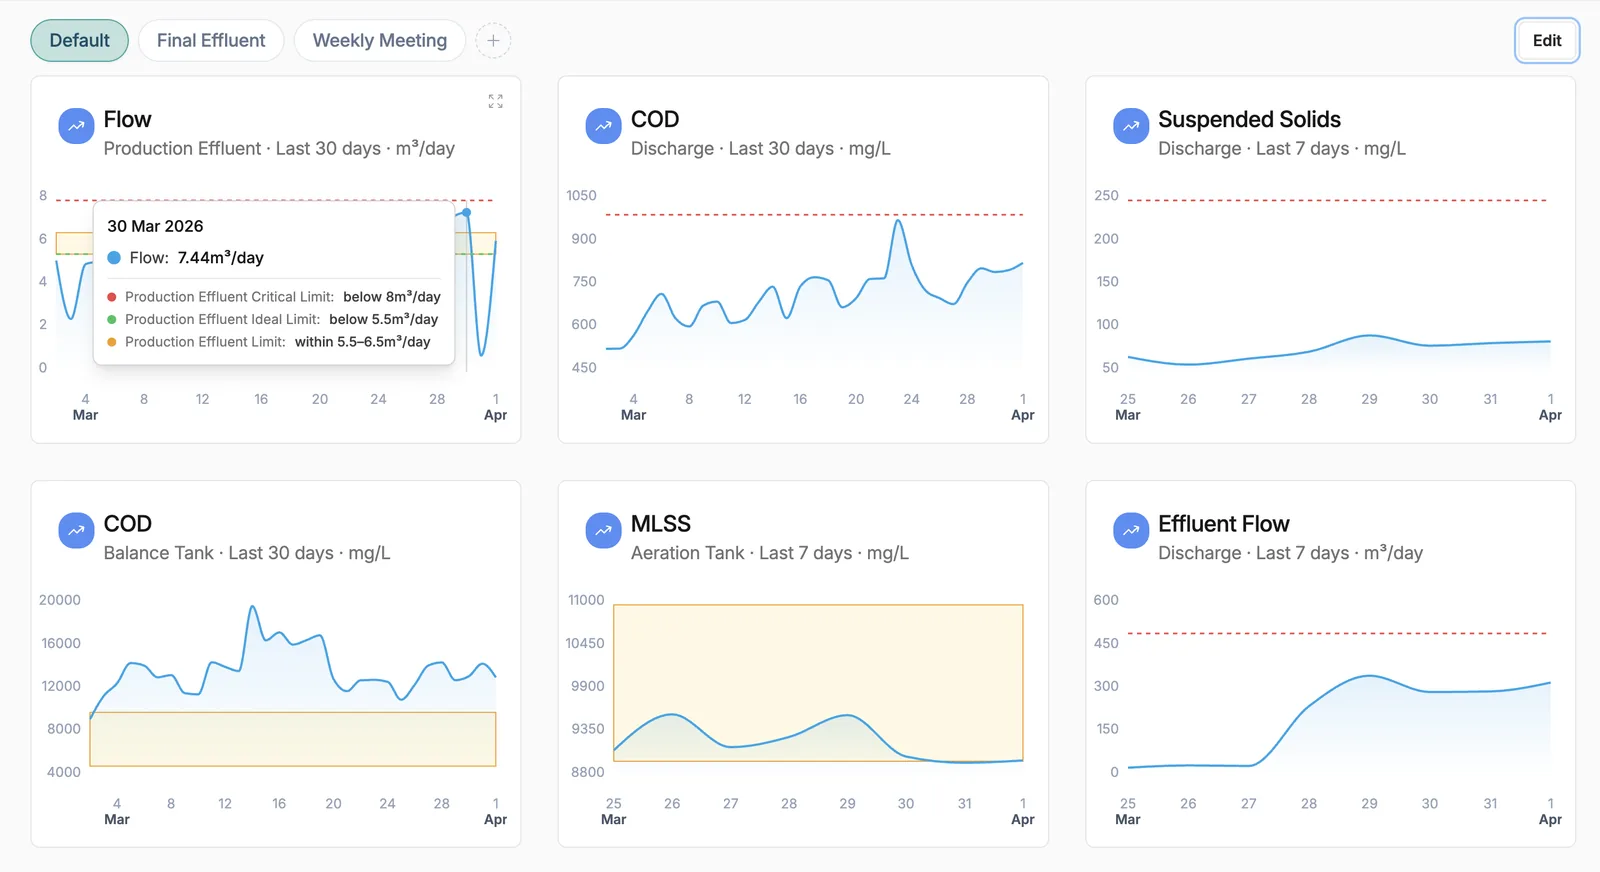
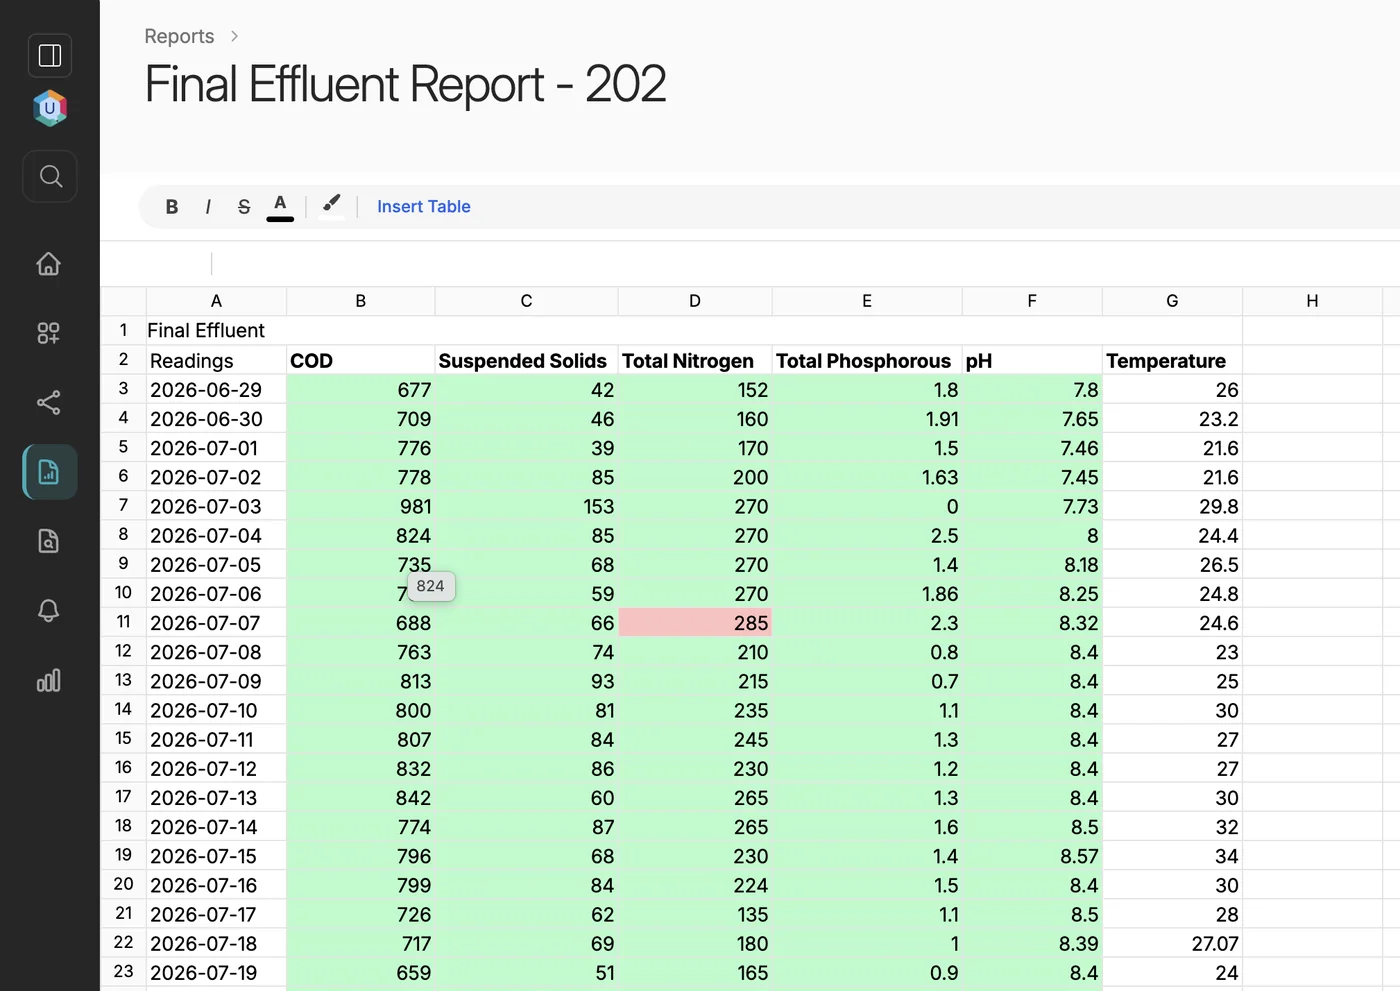
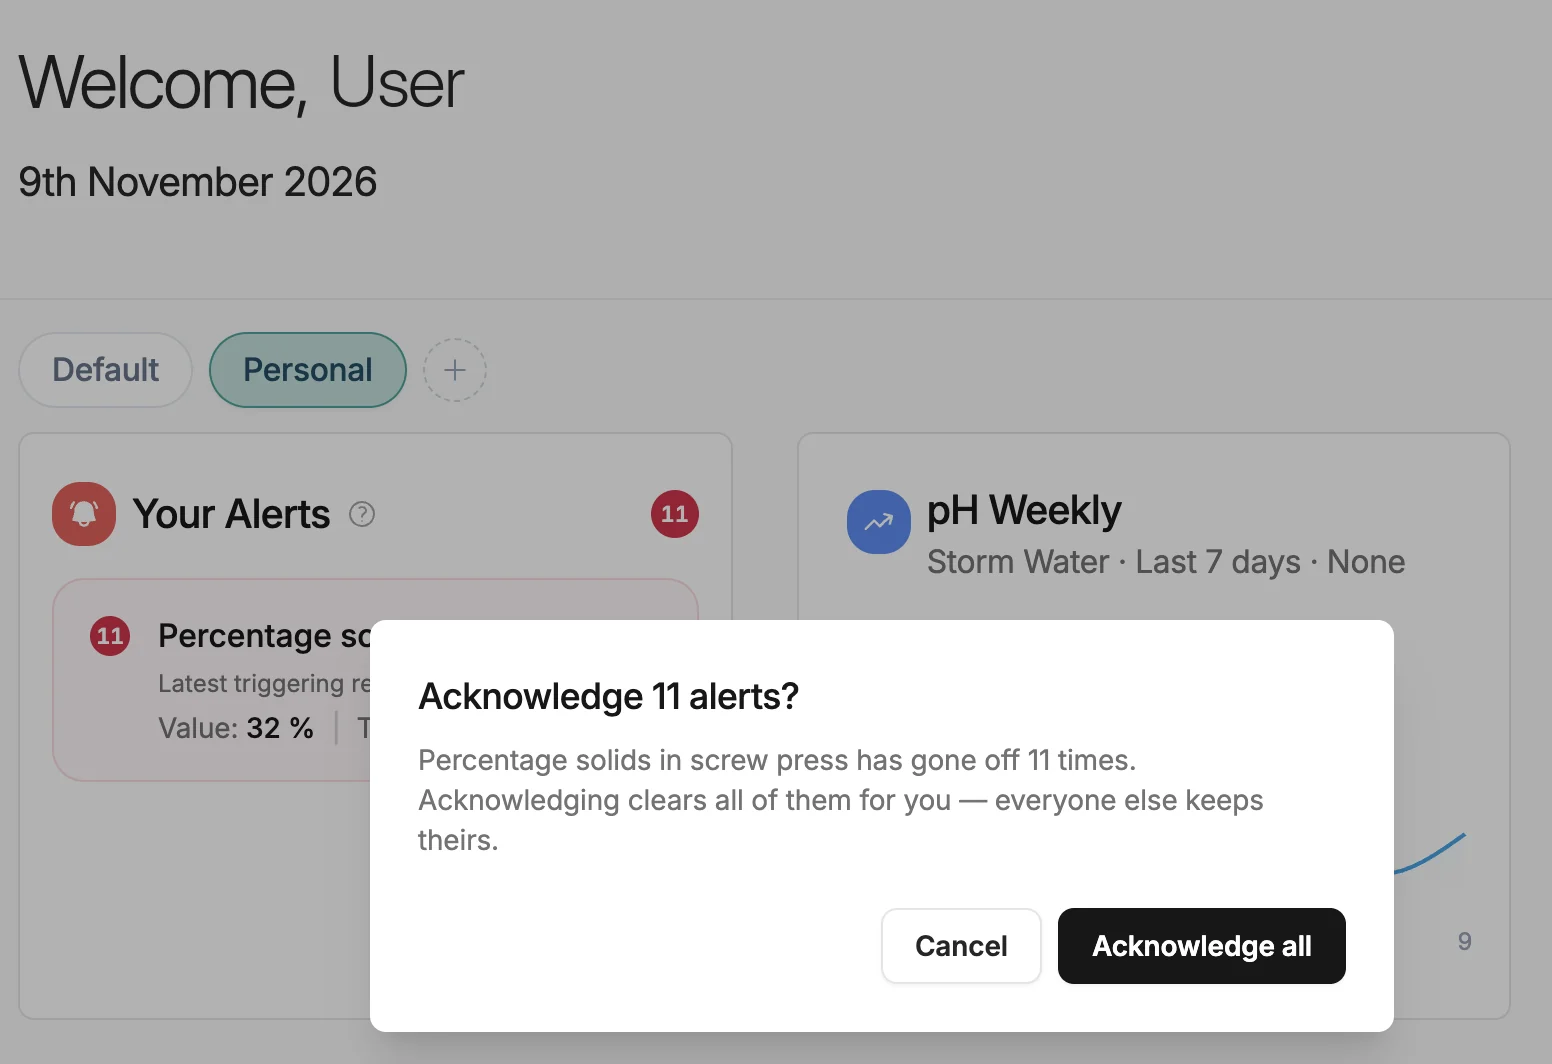
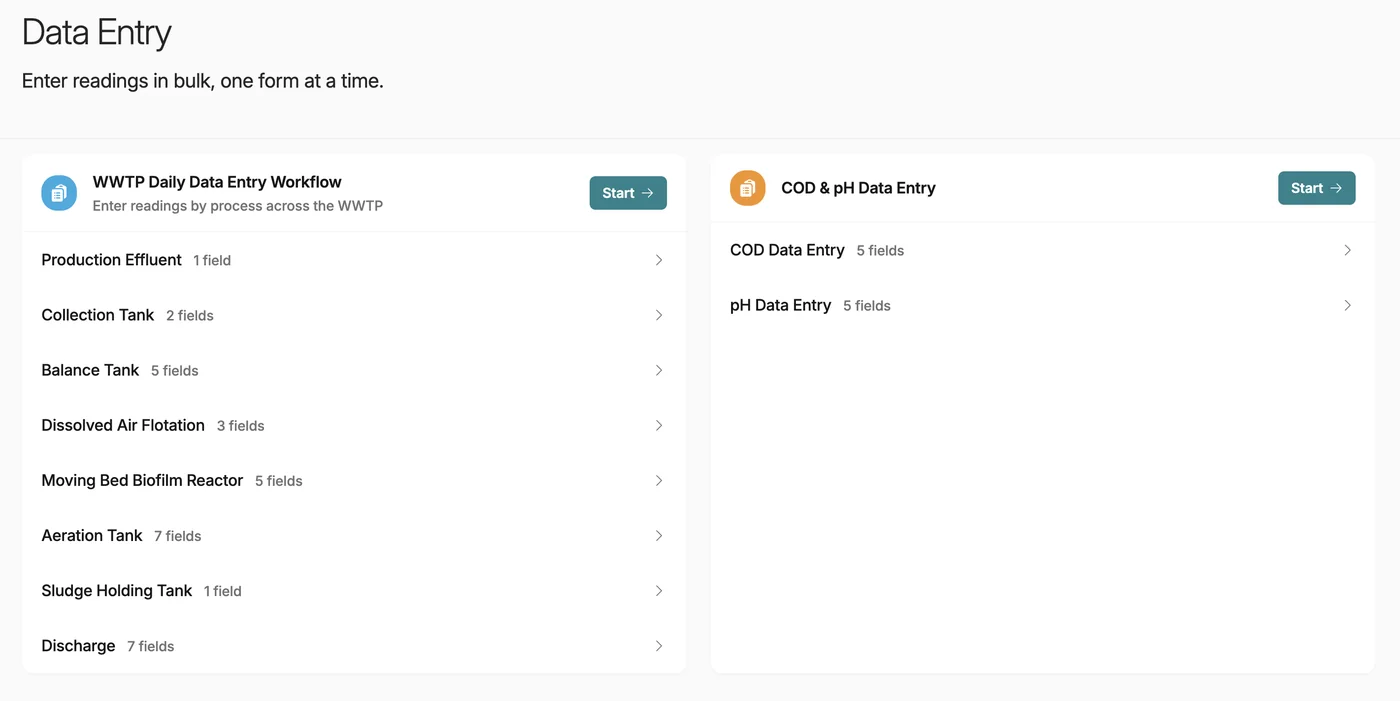
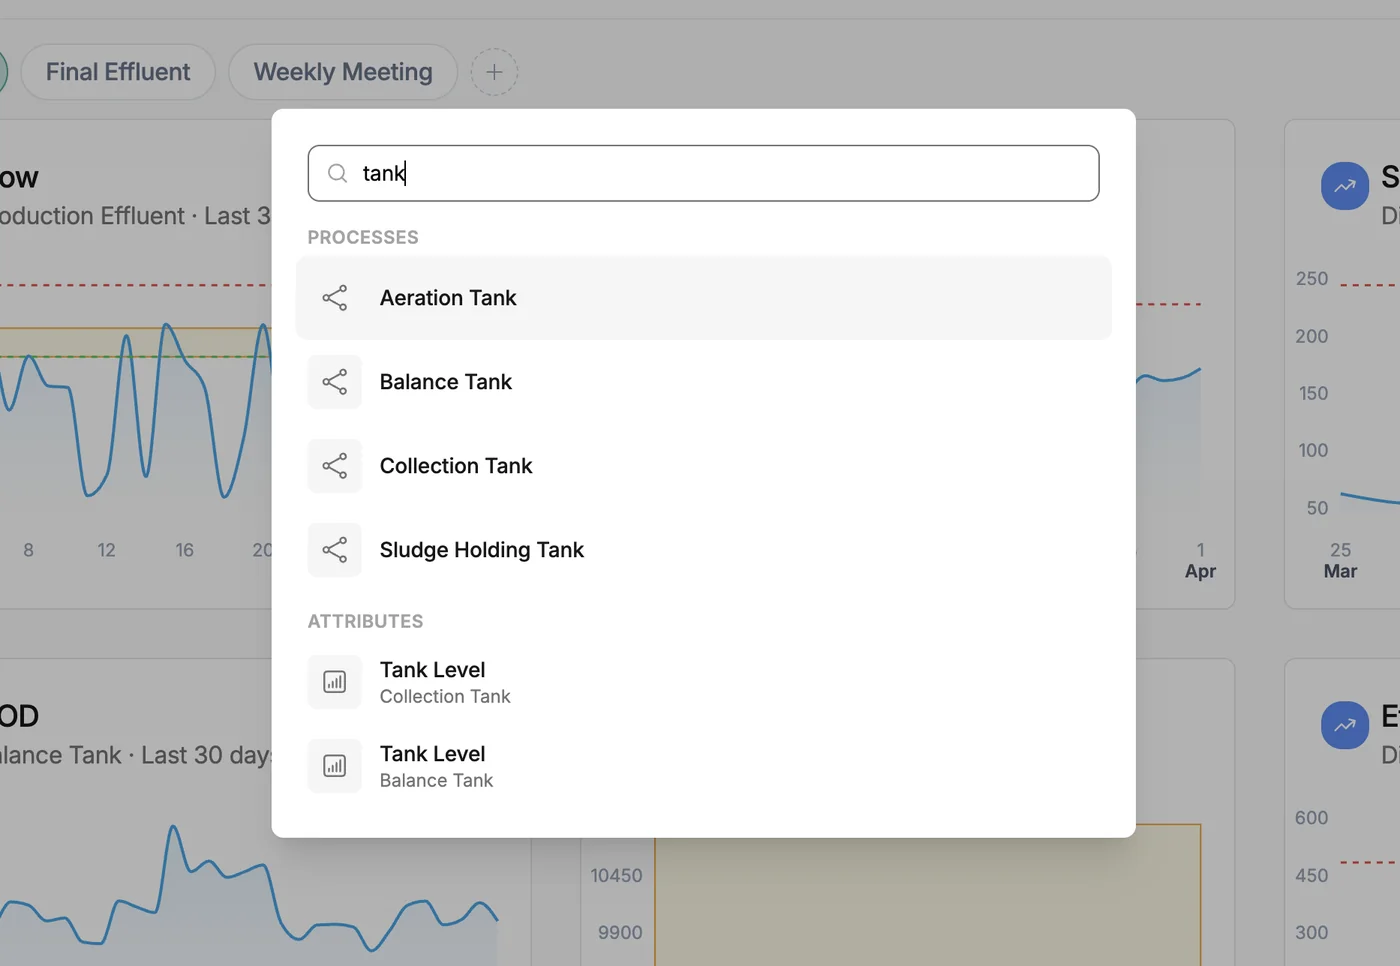
See the flow across every tank in real time. Toggle effortlessly between your Plant Overview Dashboard and your own personal dashboards. Neptune turns your daily HMI and lab entries into interactive, customisable trend charts with clear target zones, making it easy to spot biological shifts, equipment wear or seasonal cost spikes before they become problems.